Includes historical data for Niger’s Gross Domestic Product growth, debt-to-GDP ratio and more, as well as information on trade, banking and financial sector leadership.
Political Instability Hampers Economic Growth
A landlocked country in the Sahel region north of Nigeria, Niger faces a complex economic and political landscape. In the nation’s first democratic transfer of power since gaining independence from France in 1960, Mohamed Bazoum assumed the presidency in April 2021. The government implemented reforms aimed at liberalizing the economy, privatizing sectors, and establishing export processing zones to attract foreign direct investment (FDI). However, Bazoum’s tenure was cut short by an army-led coup in July 2023.
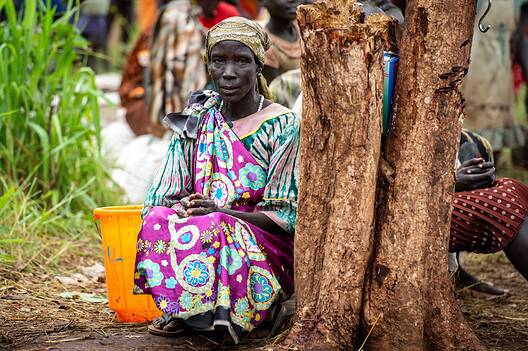
Today, Niger remains one of the world’s poorest nations. Uranium, gold and oil exports are the cornerstones of its economy, with agriculture also accounting for approximately 40% of GDP, leaving Niger vulnerable fluctuations in commodity prices. Additional challenges include insecurity exacerbated by violent extremist organizations, a fragile rule of law susceptible to political meddling, inadequate infrastructure, and an underdeveloped labor market characterized by a significant informal sector. Niger is also prone to recurrent droughts and other climate shocks, compounding problems for the population.
Macroeconomy & Sovereign Data
| Type of Government | Semi-presidential republic |
|---|---|
| Capital | Niamey |
| Sovereign Ratings |
S&P: Not rated Moody’s: Caa2 Fitch: Not rated |
| Total Population | 28.1 million |
| Median Age | 14.6 |
| Adult Per Capita Income (PPP) | 3,592.70 |
| Total GDP (2023) | 18.8 billion |
Niger GDP & Economic Overview
Most Recent Content
Niger
Economic Data
Poorest Countries in the World 2025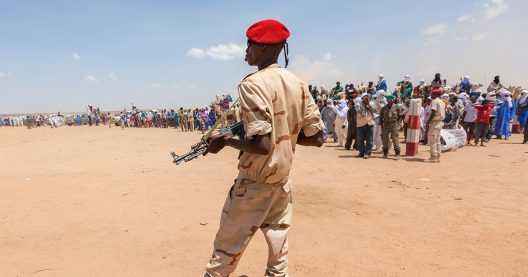
Capital Raising & Corporate Finance
ANNUAL SURVEY: WORLD’S BEST BANKS 2014Awards
BEST BANKS 2014: AFRICABanking & Finance
Trade & Investment
| Total Exports | USD 1.4 billion (2023) |
|---|---|
| Leading Exports |
Gold Sesame Seeds Uranium Refined Petroleum Onions |
| Total Imports | USD 3.1 billion (2022) |
| Leading Imports |
Rice Packaged Medicines Palm Oil Cars Cement |
| Source: | World Integrated Trade Solution |
Niger Leading Companies
| Sonidep | Oil & Gas Exploration & Production |
|---|---|
| Nigelec | Utilities |
| Société des Mines de l'Air | Materials, Metals & Mining |
| Cominak | Materials, Metals & Mining |
| Société Nigérienne du Charbon | Materials, Metals & Mining |
| Niger Telecoms | Telecommunication Services |
Major Trade Partners — Import
| China | 19% |
|---|---|
| France | 15% |
| Nigeria | 8% |
| India | 8% |
| United States | 6% |
Source: World Integrated Trade Solution
Major Trade Partners — Export
| France | 23% |
|---|---|
| Mali | 22% |
| Burkina Faso | 13% |
| Nigeria | 9% |
| United Arab Emirates | 9% |
Source: World Integrated Trade Solution
Global Finance Rankings & Awards

Data Sources:
UN World Population Prospects
World Inequality Report
S&P Global Ratings
Moody’s
Fitch Ratings
IMF Direction of Trade Statistics (DOTS)
UN Conference on Trade and Development (UNCTAD)
CIA The World Factbook
World Bank’s World Integrated Trade Solution
Forbes Global 2000