Includes historical data for Bahrain’s Gross Domestic Product growth, debt-to-GDP ratio and more, as well as information on trade, banking and financial sector leadership.
Financial Hub With A Robust Banking Sector
This small and affluent island country near the western shores of the Persian Gulf fosters a favorable investment climate and prioritizes foreign investment diversification. While state-owned enterprises remain the primary driver of growth, the Kingdom of Bahrain is seeking to expand private sector contributions, reduce reliance on hydrocarbons and bolster the startup ecosystem. With a robust banking sector and a more diversified economy compared with many of its Gulf neighbors, Bahrain is an established financial hub, a tourist destination and a top global supplier of aluminum products. Vulnerabilities include high debt, exposure to swings in commodity prices, lack of transparency, and heavy dependence on foreign workers.
Macroeconomy & Sovereign Data
| Type of Government | Constitutional monarchy |
|---|---|
| Capital | Manama |
| Sovereign Ratings |
S&P: B Moody’s: B2 Fitch Ratings: B+ |
| Total Population | 1.657 million |
| Median Age | 33.35 |
| Adult Per Capita Income (PPP) | 70.762.74 |
| Total GDP (2025) | 47.391 billion |
Bahrain GDP & Economic Overview
Most Recent Content
Bahrain
Economics, Policy & Regulation
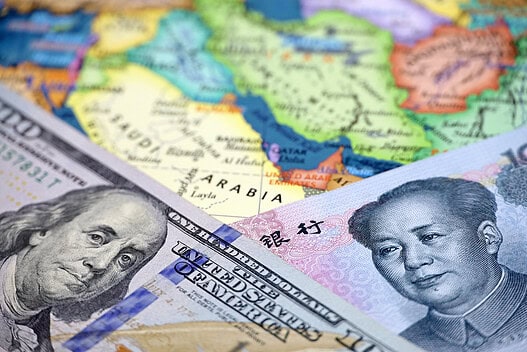
GCC’s Balancing Act Amid US-China Tensions
Economics, Policy & Regulation
Central Banker Report Cards 2024: Africa And The Middle East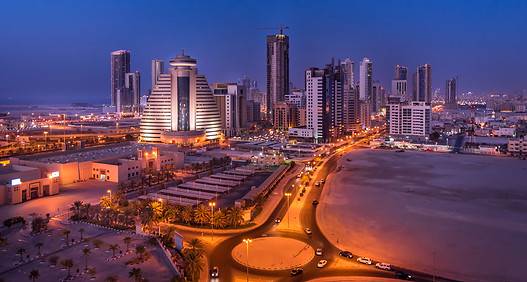
Economics, Policy & Regulation
Bahrain: Looking For Buy-In
Banking & Finance
Trade & Investment
| Total Exports | USD 11.59 billion (2024) |
|---|---|
| Leading Exports |
Aluminum Refined Petroleum Iron Ore Aluminum Wire Iron Blocks |
| Total Imports | USD 15.62 billion (2024) |
| Leading Imports |
Iron Ore Aluminum Oxide Cars Gold Ships |
| Source: | CIA World Factbook, International Monetary Fund. |
Bahrain Leading Companies
| Arab Banking Corporation | Financials |
|---|---|
| National Bank of Bahrain | Financials |
| Gulf International Bank | Financials |
| Aluminium Bahrain (Alba) | Materials, Metals & Mining |
| Batelco | Telecommunication Services |
| Bahrain Petroleum Company | Integrated Oil & Gas |
| Banagas | Oil & Gas Refining & Marketing |
Major Trade Partners — Import
| Australia | 8.71% |
|---|---|
| United Arab Emirates | 8.26% |
| United States | 6.49% |
| India | 5.82% |
| Saudi Arabia | 5.72% |
Source: World Integrated Trade Solution
Major Trade Partners — Export
| Unspecified | 32.03% |
|---|---|
| Saudi Arabia | 13.70% |
| United States | 8.63% |
| United Arab Emirates | 7.38% |
| Netherlands | 3.47% |
Source: World Integrated Trade Solution
Global Finance Rankings & Awards


Data Sources:
UN World Population Prospects
World Inequality Report
S&P Global Ratings
Moody’s
Fitch Ratings
IMF Direction of Trade Statistics (DOTS)
UN Conference on Trade and Development (UNCTAD)
CIA The World Factbook
World Bank’s World Integrated Trade Solution
Forbes Global 2000