Includes historical data for Central African Republic’s Gross Domestic Product growth, debt-to-GDP ratio and more, as well as information on trade, banking and financial sector leadership.
Strategic Location And Political Stability Produce Economic Benefits
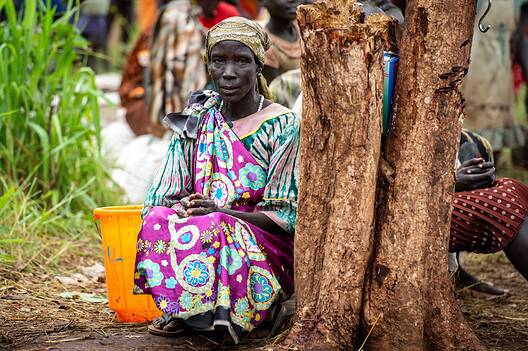
Since gaining independence from France in 1960, the Central African Republic (CAR) has been mired in political instability and sectarian violence. Despite its significant economic potential, the country is home to some 5 million people amongst the poorest in the world. Rich in agricultural and forestry resources, the nation also possesses major reserves of diamonds, gold, oil and uranium. In a historic moment in 2016, the Central African Republic held its first democratic presidential election since independence, a significant step toward national reconstruction. However, despite this progress, significant portions of the country remain under the control of anti-government factions and militia groups vying for control of the country’s vast resources.
Additional challenges hindering the country’s economic growth and development include weak transport infrastructure and geographic isolation, limited energy production capacity, and pervasive corruption. The CAR also struggles with a shortage of skilled labor and one of the widest gender gaps in the world.
Macroeconomy & Sovereign Data
| Type of Government | Presidential republic |
|---|---|
| Capital | Yaounde |
| Sovereign Ratings |
S&P: Not rated Moody’s: Not rated Fitch: Not rated |
| Total Population | 5.2 million |
| Median Age | 14.9 |
| Adult Per Capita Income (PPP) | 2,327.42 |
| Total GDP (2023) | 2.8 billion |
Central African Republic GDP & Economic Overview
Most Recent Content
The Central African Republic
Economic Data
Poorest Countries in the World 2025


Award Winners
Growing With StartupsBanking & Finance
Trade & Investment
| Total Exports | USD 453.1 million (2023) |
|---|---|
| Leading Exports |
Gold Lumber Diamonds Large Construction Vehicles Rum |
| Total Imports | USD 180.9 million (2022) |
| Leading Imports |
Refined Petroleum Packaged Medicines Natural Gas Broadcasting Equipment Second-Hand Clothing |
| Source: | World Integrated Trade Solution |
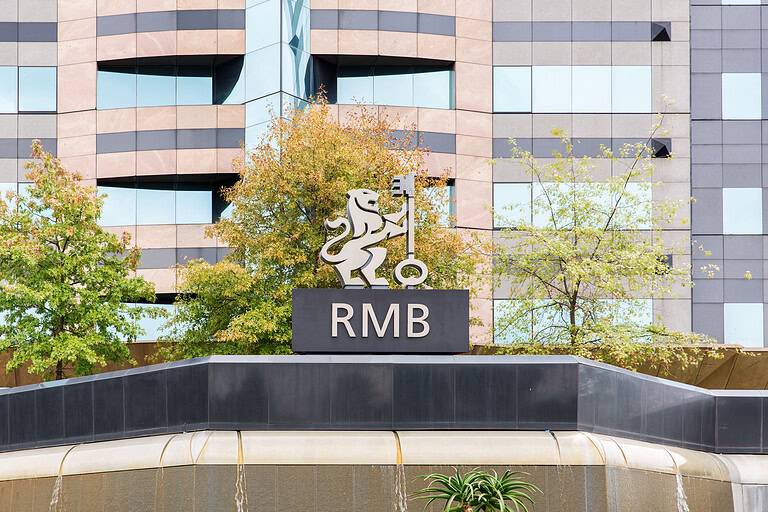
Central African Republic Leading Companies
| Banque Internationale pour la Centrafrique (BICA) | Financials |
|---|---|
| Commercial Bank Centrafrique (CBCA) | Financials |
| Société Nationale des Hydrocarbures | Oil & Gas Exploration & Production |
| Enerca | Utilities |
| Groupe Kamach | Conglomerate, Consumer Staples Retail, Forest Products, Mining |
| Socatel | Telecommunication Services |
| Société Centrafricaine de Distribution | Consumer Staples Distribution & Retail |
Major Trade Partners — Import
| Cameroon | 26% |
|---|---|
| China | 17% |
| France | 14% |
| Belgium | 7% |
| Italy | 5% |
Source: World Integrated Trade Solution
Major Trade Partners — Export
| United Arab Emirates | 25% |
|---|---|
| Sweden | 15% |
| France | 10% |
| Switzerland | 8% |
| Uganda | 7% |
Source: World Integrated Trade Solution
Global Finance Rankings & Awards


Data Sources:
UN World Population Prospects
World Inequality Report
S&P Global Ratings
Moody’s
Fitch Ratings
IMF Direction of Trade Statistics (DOTS)
UN Conference on Trade and Development (UNCTAD)
CIA The World Factbook
World Bank’s World Integrated Trade Solution
Forbes Global 2000