Includes historical data for Ecuador’s Gross Domestic Product growth, debt-to-GDP ratio and more, as well as information on trade, banking and financial sector leadership.
Economic Strength Based on Natural Resources And Dollarization
Situated at the western edge of the Andes, Ecuador benefits from abundant oil and mineral reserves, vast marine resources, and geographical and climate diversity enabling the cultivation of different crops and fostering a thriving tourism industry. The full dollarization of the economy, while exposing Ecuador to external economic downturns and recessions, generally enhances monetary stability.
Despite these strengths, this country of fewer than 20 million inhabitants faces significant challenges. High debt, opaque and inconsistent commercial laws, corruption and organized crime hinder private sector initiatives and deter foreign investors. Additionally, despite efforts to bolster economic diversification by prioritizing growth in sectors such as clean energy, new technologies and healthcare, the economy remains heavily reliant on oil. Threats from climate-related disasters, a shortage of high-skilled workers, and political instability further compound these challenges.
Macroeconomy & Sovereign Data
| Type of Government | Presidential republic |
|---|---|
| Capital | Quito |
| Sovereign Ratings |
S&P: BB Moody’s: Ba3 Fitch: BB– |
| Total Population | 18.5 million |
| Median Age | 28.7 |
| Adult Per Capita Income (PPP) | 16,330.65 |
| Total GDP (2023) | $121.6 billion |
Ecuador GDP & Economic Overview
Most Recent Content
Ecuador
Economics, Policy & Regulation
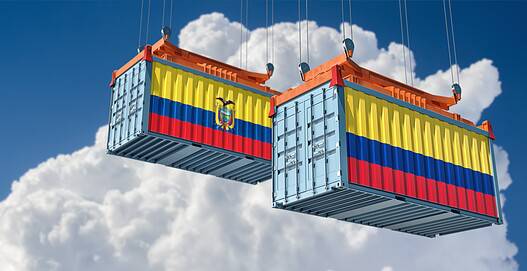
Ecuador Slashes Colombia Import Tariffs to 75%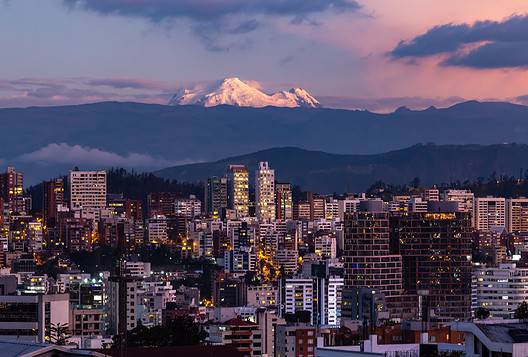
Emerging & Frontier Markets
Ecuador: Aiming For A Turnaround
Economics, Policy & Regulation
Latin America Adopts Dual Currencies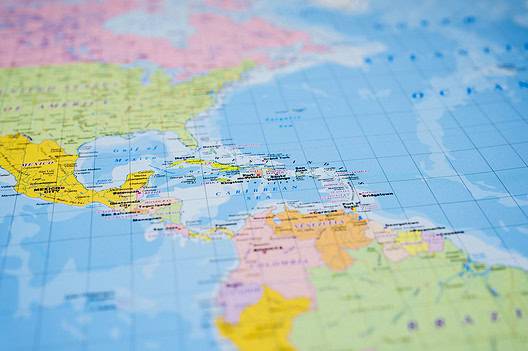
Economics, Policy & Regulation
Central Banker Report Cards 2024: The AmericasBanking & Finance
Trade & Investment
| Total Exports | USD 27.3 billion (2023) |
|---|---|
| Leading Exports |
Crude Petroleum Shrimp Bananas Refined Petroleum Tuna |
| Total Imports | USD 34.0 billion (2022) |
| Leading Imports |
Refined Petroleum Coal Tar Oil Cars Packaged Medicines Soybean Products |
| Source: | World Integrated Trade Solution |
Ecuador Leading Companies
| Banco Pichincha | Financials |
|---|---|
| Produbanco | Financials |
| Banco Guayaquil | Financials |
| Petroecuador | Food & Staples Retailing |
| Grupo Eljuri | Conglomerates, Consumer Discretionary, Real Estate |
| La Fabrica | Consumer Staples, Dairy Products |
| Corporación Favorita (Supermaxi) | Consumer Discretionary, Food & Staples Retailing |
Major Trade Partners — Import
| China | 24% |
|---|---|
| United States | 22% |
| Colombia | 7% |
| Brazil | 4% |
| South Korea | 4% |
Major Trade Partners — Export
| United States | 24% |
|---|---|
| China | 15% |
| Panama | 15% |
| Chile | 4% |
| Russia | 4% |
Global Finance Rankings & Awards

Data Sources:
UN World Population Prospects
World Inequality Report
S&P Global Ratings
Moody’s
Fitch Ratings
IMF Direction of Trade Statistics (DOTS)
UN Conference on Trade and Development (UNCTAD)
CIA The World Factbook
World Bank’s World Integrated Trade Solution
Forbes Global 2000