
Includes historical data for Mauritius’ Gross Domestic Product growth, debt-to-GDP ratio and more, as well as information on trade, banking and financial sector leadership.
Diversified Economy Promotes Broad-Based Prosperity
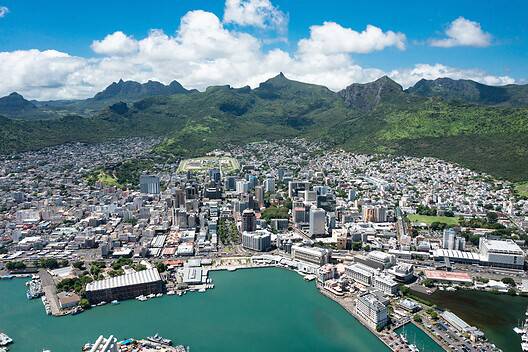
This island nation in the Indian Ocean archipelago has rapidly transformed from one of Africa’s poorest countries at independence from Britain in 1968 to one of the continent’s wealthiest. Once heavily reliant on sugarcane monoculture, Mauritius has diversified its economy and achieved upper middle-income status. Remarkably, Mauritius also briefly reached high-income status in 2020 before th pandemic damaged the economy, prompting a reversal. Now on the path to full economic recovery, the country’s prosperity is underpinned by thriving sectors such as tourism, financial services, manufacturing, information and communication technology, seafood processing, real estate, and outsourcing. Furthermore, Mauritius’ democratic institutions, strategic location between Africa and Asia, and the bilingualism of its French-English workforce enhance its attractiveness as a business hub.
Mauritius does face several challenges. With a small domestic market, it heavily depends on Europe and Asia for commercial, economic and political support. The country relies heavily on imports for food and energy. Inadequate infrastructure, an inefficient regulatory environment, and a lack of skilled workers further stifle economic growth.
Mauritius GDP & Economic Overview
Macroeconomy & Sovereign Data
| Type of Government | Parliamentary Democracy |
|---|---|
| Capital | Port Louis |
| Sovereign Ratings |
S&P: Not rated Moody’s: Baa3 Fitch: Not rated |
| Total Population | 1.27 million |
| Median Age | 37.8 |
| Adult Per Capita Income (PPP) | 33,094 |
| Total GDP (2024) | 14.95 billion |

Dr. Priscilla Muthoora Thakoor was appointed Governor of Bank of Mauritius on September 25th, 2025 for a three-year term.
Most Recent Content
Mauritius
Emerging & Frontier Markets
Mauritius: Balancing Growth And Discontent
Economics, Policy & Regulation
Ramgoolam’s Comeback Signals New Era For Mauritius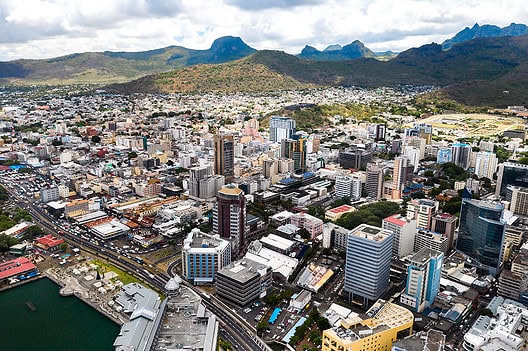
Economics, Policy & Regulation
Mauritius At A Crossroads
Country Report
Mauritius: Road To RenewalBanking & Finance
Trade & Investment
| Total Exports | USD 1.8 billion (2024) |
|---|---|
| Leading Exports |
Clothing And Apparel Skipjack And Tuna Raw Sugar Fertilizers Diamonds |
| Total Imports | USD 5.4 billion (2024) |
| Leading Imports |
Refined Petroleum Cars Fish Products Aircraft Packaged Medicines |
| Source: | World Integrated Trade Solution |
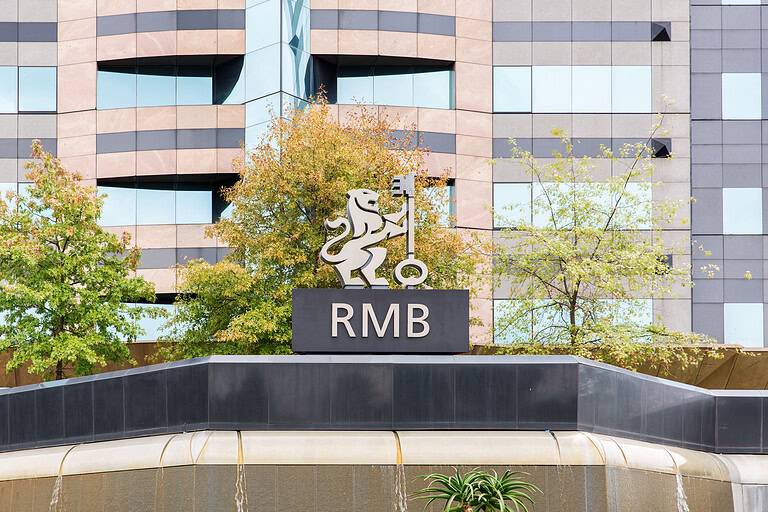
Mauritius Leading Companies
| SBM Group | Financials |
|---|---|
| MCB Group | Financials |
| AfrAsia Bank | Financials |
| Espitalier Noel Group | Conglomerate, Trading, Retail, Financials |
| CIEL | Conglomerate, Food Products, Financials, Real Estate |
| Eclosia Group | Consumer Staples, Food Products |
| Phoenix Beverages | Consumer Staples, Brewers |
| IHS Towers | Telecommunication Services |
| IBL Group | Conglomerate, Financials, Industrials, Retail |
Major Trade Partners — Import
| China | 18% |
|---|---|
| India | 16% |
| United Arab Emirates | 9% |
| South Africa | 8% |
| France | 7% |
Source: World Integrated Trade Solution
Major Trade Partners — Export
| South Africa | 14% |
|---|---|
| France | 14% |
| United Kingdom | 9% |
| United States | 8% |
| Madagascar | 8% |
Source: World Integrated Trade Solution
Global Finance Rankings & Awards


Data Sources:
UN World Population Prospects
World Inequality Report
S&P Global Ratings
Moody’s
Fitch Ratings
IMF Direction of Trade Statistics (DOTS)
UN Conference on Trade and Development (UNCTAD)
CIA The World Factbook
World Bank’s World Integrated Trade Solution
Forbes Global 2000