
Includes historical data for Germany’s Gross Domestic Product growth, debt-to-GDP ratio and more, as well as information on trade, banking and financial sector leadership.
Europe’s Industrial Powerhouse
Europe’s largest economy boasts a sophisticated financial sector, a highly skilled workforce, a stable regulatory environment, a reliable infrastructure, and cutting-edge research and development resources. Politically and economically influential, Germany also ranks among the top countries in the world for inbound and outbound foreign direct investment and exports. The automotive, mechanical, chemical and electrical industries are pillars of its economy.
Weaknesses include a disproportionate dependence on trade with China and on international energy imports, the economy’s heavy reliance on a limited number of industries, and complex regulatory and accounting systems that can slow entrepreneurial activity and hinder stronger economic growth.
Macroeconomy & Sovereign Data
| Type of Government | Federal parliamentary republic |
|---|---|
| Capital | Berlin |
| Sovereign Ratings |
S&P: AAA Moody’s: Aaa Fitch: AAA |
| Total Population | 84.6 million |
| Median Age | 45.0 |
| Adult Per Capita Income (PPP) | 64,297.95 |
| Total GDP (2023) | 4.6 trillion |
Germany GDP & Economic Overview
Most Recent Content
Germany
Capital Raising & Corporate Finance
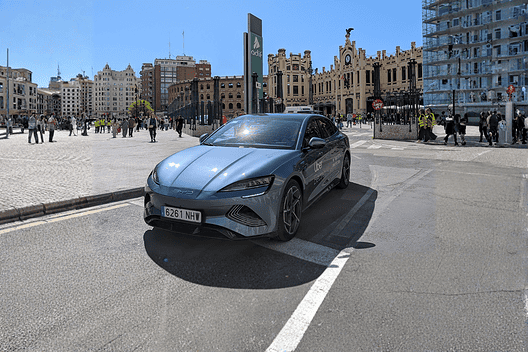
BYD Drives EV Growth Through European Banks
Capital Raising & Corporate Finance
Commerzbank Rejects UniCredit’s Takeover Offer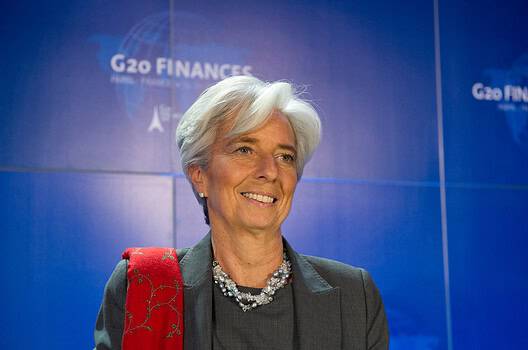
Economics, Policy & Regulation
Three Bankers Lead Pack to Replace Lagarde at ECB
Capital Raising & Corporate Finance
Defense Stocks Reload With IPO MomentumBanking & Finance
Trade & Investment
| Total Exports | USD 1.5 trillion (2023) |
|---|---|
| Leading Exports |
Cars And Vehicle Parts Packaged Medicines Medical Cultures And Vaccines Aircraft Industrial Machinery Medical Instruments |
| Total Imports | USD 1.7 trillion (2022) |
| Leading Imports |
Cars And Vehicle Parts Packaged Medicines Broadcasting Equipment Medical Cultures/Vaccines Computers |
| Source: | World Integrated Trade Solution |
Germany Leading Companies
| Allianz | Financials |
|---|---|
| Commerzbank | Financials |
| Volkswagen Group | Automobiles & Components |
| Daimler | Automobiles & Components |
| Deutsche Telekom | Media and Communications |
| Bayer | Pharmaceuticals |
| Siemens | Technology |
Major Trade Partners — Import
| China | 12% |
|---|---|
| Netherlands | 8% |
| United States | 6% |
| Poland | 6% |
| Italy | 5% |
Source: World Integrated Trade Solution
Major Trade Partners — Export
| United States | 9% |
|---|---|
| China | 8% |
| France | 7% |
| Netherlands | 7% |
| Poland | 6% |
Source: World Integrated Trade Solution
Global Finance Rankings & Awards


Data Sources:
UN World Population Prospects
World Inequality Report
S&P Global Ratings
Moody’s
Fitch Ratings
IMF Direction of Trade Statistics (DOTS)
UN Conference on Trade and Development (UNCTAD)
CIA The World Factbook
World Bank’s World Integrated Trade Solution
Forbes Global 2000