
Includes historical data for Italy’s Gross Domestic Product growth, debt-to-GDP ratio and more, as well as information on trade, banking and financial sector leadership.
One Of Europe’s Largest Economies
As one of the world’s ten largest economies, Italy excels in the business and financial services sectors, in agricultural and industrial production, and in scientific and information technology research, as well as tourism and high-end fashion and design. A founding member of the European Union, and strategically positioned near markets in North Africa and the Middle East, it is a major recipient of foreign investment. While small and medium-sized enterprises, which make up 99.9% of the total, are the main drivers of Italy’s prosperity, the informal sector still plays a significant role, and regulatory and fiscal complexities remain an obstacle to stronger economic growth.
Macroeconomy & Sovereign Data
| Type of Government | Parliamentary republic |
|---|---|
| Capital | Milan |
| Sovereign Ratings |
S&P: BBB Moody’s: Baa3 Fitch: BBB |
| Total Population | 58.8 million |
| Median Age | 48.1 |
| Adult Per Capita Income (PPP) | 49,320.46 |
| Total GDP (2023) | 2.3 trillion |
Italy GDP & Economic Overview
Most Recent Content
Italy
Capital Raising & Corporate Finance
Commerzbank Rejects UniCredit’s Takeover Offer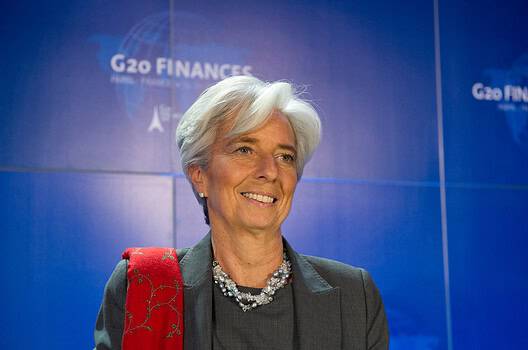
Economics, Policy & Regulation
Three Bankers Lead Pack to Replace Lagarde at ECB
Capital Raising & Corporate Finance
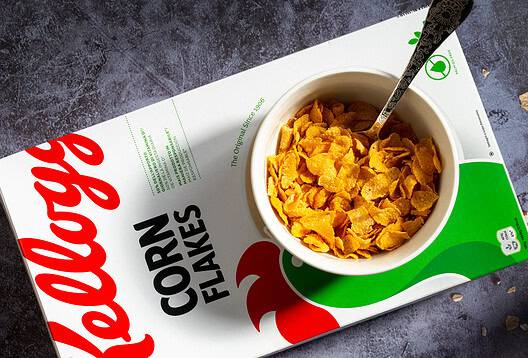
Giovanni Ferrero Scoops Up WK KelloggBanking & Finance
Trade & Investment
| Total Exports | USD 655.5 billion (2023) |
|---|---|
| Leading Exports |
Packaged Medicines Cars And Vehicle Parts Refined Petroleum Vaccines And Cultures Jewelry Valves |
| Total Imports | USD 662.8 billion (2022) |
| Leading Imports |
Crude Petroleum Cars Packaged Medicines Natural Gas Refined Petroleum |
| Source: | World Integrated Trade Solution |
Italy Leading Companies
| Intesa Sanpaolo | Financials |
|---|---|
| UniCredit | Financials |
| Enel | Energy, Electric Utilities |
| Telecom Italia | Telecommunication Services |
| The Ferrero Group | Consumer Staples, Packaged Foods |
| Ferrari | Automobiles & Components |
| Parmalat | Consumer Staples, Dairy Products |
Major Trade Partners — Import
| Germany | 16% |
|---|---|
| France | 8% |
| China | 8% |
| Netherlands | 6% |
| Spain | 5% |
Source: World Integrated Trade Solution
Major Trade Partners — Export
| Germany | 13% |
|---|---|
| France | 10% |
| United States | 9% |
| Switzerland | 5% |
| Spain | 5% |
Source: World Integrated Trade Solution
Global Finance Rankings & Awards

Data Sources:
UN World Population Prospects
World Inequality Report
S&P Global Ratings
Moody’s
Fitch Ratings
IMF Direction of Trade Statistics (DOTS)
UN Conference on Trade and Development (UNCTAD)
CIA The World Factbook
World Bank’s World Integrated Trade Solution
Forbes Global 2000