Includes historical data for Poland’s Gross Domestic Product growth, debt-to-GDP ratio and more, as well as information on trade, banking and financial sector leadership.
Economy Benefits From Business-Friendly Policies
With a population of approximately 37 million, Poland benefits from its strategic proximity to Western European markets, a diverse economy, and an educated and cost-effective labor force. The Polish government advocates for open-market policies and has made significant progress in digitalizing administrative processes, streamlining business start-up procedures, and attracting foreign capital.
Nevertheless, there are challenges. Structural unemployment, the emigration of a considerable number of skilled workers to other EU countries, and low investment in innovation and research contribute to a developmental gap when compared to some neighboring countries. A polarized political environment, weaknesses in the legal and regulatory framework, and the influx of a large number of refugees, particularly from Ukraine, pose additional concerns.
Macroeconomy & Sovereign Data
| Type of Government | Parliamentary republic |
|---|---|
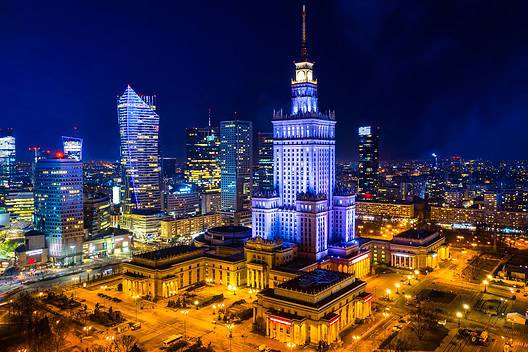
| Capital | Warsaw |
| Sovereign Ratings |
S&P: A– Moody’s: A2 Fitch: A– |
| Total Population | 36.7 million |
| Median Age | 40.9 |
| Adult Per Capita Income (PPP) | 44,477.83 |
| Total GDP (2023) | 844.6 billion |
Poland GDP & Economic Overview
Most Recent Content
Poland

Economics, Policy & Regulation
Poland: Warsaw Spreads Its Wings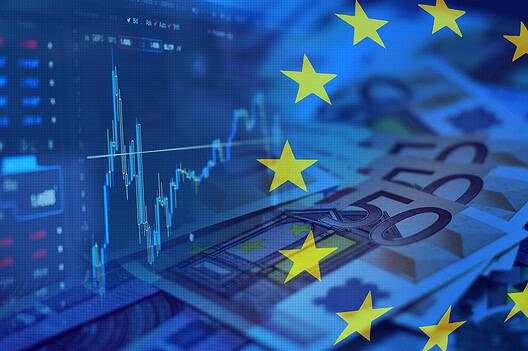
Economics, Policy & Regulation
Central Banker Report Cards 2024: Europe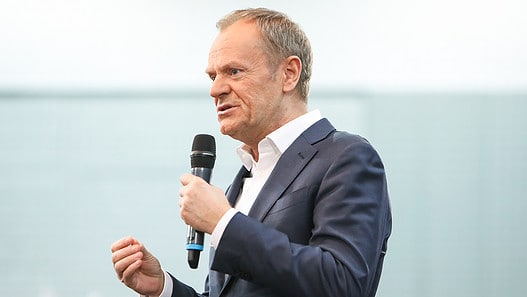
Economics, Policy & Regulation
Poland: Welcoming Europe Back InBanking & Finance
Trade & Investment
| Total Exports | USD 417.7 billion (2023) |
|---|---|
| Leading Exports |
Cars And Vehicle Parts Seats Furniture Electric Batteries Computers |
| Total Imports | USD 343.8 billion (2022) |
| Leading Imports |
Cars And Vehicle Parts Crude Petroleum Packaged Medicines Broadcasting Equipment Office Machinery/Parts |
| Source: | World Integrated Trade Solution |
Poland Leading Companies
| PKO Bank Polski | Financials |
|---|---|
| Grupa PZU | Financials |
| Bank Pekao | Financials |
| ORLEN Group | Oil, Gas & Consumable Fuels |
| PKN Orlen | Oil, Gas & Consumable Fuels |
| KGHM Polska Miedz | Metals & Mining |
| PGE Polska Grupa Energetyczna | Electric Utilities |
Major Trade Partners — Import
| Germany | 21% |
|---|---|
| China | 15% |
| Russia | 6% |
| Italy | 5% |
| Netherlands | 4% |
Source: World Integrated Trade Solution
Major Trade Partners — Export
| Germany | 29% |
|---|---|
| Czech Republic | 6% |
| France | 6% |
| United Kingdom | 5% |
| Italy | 4% |
Source: World Integrated Trade Solution
Global Finance Rankings & Awards

Data Sources:
UN World Population Prospects
World Inequality Report
S&P Global Ratings
Moody’s
Fitch Ratings
IMF Direction of Trade Statistics (DOTS)
UN Conference on Trade and Development (UNCTAD)
CIA The World Factbook
World Bank’s World Integrated Trade Solution
Forbes Global 2000