
Includes historical data for Taiwan’s Gross Domestic Product growth, debt-to-GDP ratio and more, as well as information on trade, banking and financial sector leadership.
Dominating The Global Semiconductor Industry
Taiwan is one of the world’s top 20 economies in terms of GDP and the global leader in semiconductor manufacturing, contributing over 60% of the world’s raw semiconductors and more than 90% of the most advanced ones.
A crucial locus for regional and global trade and investment, Taiwan, with a population of around 23 million and a highly skilled labor force of roughly half that, boasts a well-developed institutional framework, a wide range of financial services, and attractive incentives for foreign investors. Challenges include over-reliance on the technology sector and mainland Chinese demand, an aging population and tenuous diplomatic status.
Macroeconomy & Sovereign Data
| Type of Government | Democracy |
|---|---|
| Capital | Taipei |
| Sovereign Ratings |
S&P: AA+ Moody’s: Aa3 Fitch: AA- |
| Total Population | 23.3 million |
| Median Age | 44.79 |
| Adult Per Capita Income (PPP) | 86,794.95 |
| Total GDP (2025) | 884.4 billion |
Taiwan GDP & Economic Overview
Most Recent Content
Taiwan

Emerging & Frontier Markets
Taiwan: Powering Ahead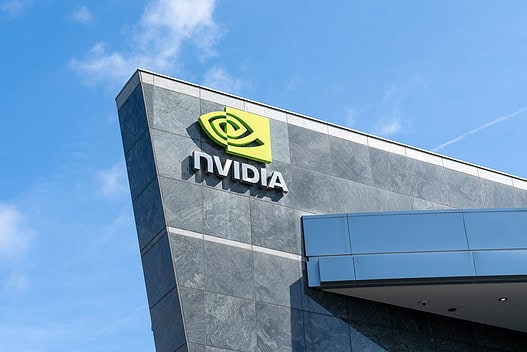
Economics, Policy & Regulation
Nvidia In Trade Tug-Of-War
Economics, Policy & Regulation
Central Banker Report Cards 2024: Asia-Pacific
Banking & Finance
Trade & Investment
| Total Exports | n/a (2024) |
|---|---|
| Leading Exports |
Integrated Circuits Machine Parts Computers Broadcasting Equipment Plastics |
| Total Imports | n/a (2024) |
| Leading Imports |
Integrated Circuits Crude Petroleum Machinery Natural Gas Coal |
| Source: | IMF, CIA The World Factbook |
Taiwan Leading Companies
| Bank of Taiwan | Financials |
|---|---|
| Taiwan Semiconductor Manufacturing Company | Technology, Semiconductors |
| MediaTek | Technology, Semiconductors |
| Hon Hai Precision Industry | Technology, Electronics Manufacturing Services |
| Quanta Computer Inc. | Technology, Hardware & Equipment |
| Cathay Financial Holding | Conglomerates, Financials, Insurance |
| Evergreen Marine Corp. | Transportation, Shipping & Ports |
Global Finance Rankings & Awards


Data Sources:
UN World Population Prospects
World Inequality Report
S&P Global Ratings
Moody’s
Fitch Ratings
IMF Direction of Trade Statistics (DOTS)
UN Conference on Trade and Development (UNCTAD)
CIA The World Factbook
World Bank’s World Integrated Trade Solution
Forbes Global 2000