
The Consumer Price Index only tells part of the story.
Two years ago, inflation reached a 40-year high in the United States. Globally, it grew in 179 out of 194 nations compared to 2020. Since then inflation’s global growth slowed, prompting hopes that prices paid by consumers would soon return to normal.
Unfortunately, bringing inflation down does not mean that consumer prices will revert to what they once were—they will just stop increasing so quickly and dramatically.
It is also important to point out the distinction between overall inflation and core inflation which is the key metric of the Consumer Price Index. The first includes food and energy prices—which are more sensitive to seasonal factors and fluctuate more rapidly—while the latter excludes food and energy prices because of their volatility. Core inflation sticks longer since gasoline prices fluctuate more than the prices of the cars fueled by said gasoline.
The most immediate inflation-fighting tool in the hands of policymakers is for the central bank to raise interest rates. Doing so dampens lending and thereby the overall economic activity that drives price increases. But sometimes the cure can be worse than the disease—raising interest rates at the wrong time or to the wrong level can trigger a recession, so central bankers tend to tread cautiously. However, this caution may have hamstrung the kind of bold action that was necessary to successfully confront and contain the unprecedented, dramatic surge in inflation across the globe in the aftermath of the 2020 pandemic.
Let’s rewind. In 2020—at the onset and during the worst phase of the pandemic—the increase in prices was relatively small. But a sudden, steep climb began in early 2021 with the easing of lockdowns and partial restoration of normal economic activity. Encouraged by the almost concomitant vaccine rollout in many countries, central bankers around the world were perhaps overly optimistic: they often described the first spikes in inflation as just “blips” bound to disappear soon.
They were certainly right about the main reason for those blips: Covid-19 had caused serious disruption to the global economy—supply-chain bottlenecks meant that demands for what consumers and firms wanted and needed could not be met which prompted demand to far exceed supply, driving prices upwards. What they could not imagine is that new variants of the virus would continue to bubble up, that so many people would resist or outright reject mask mandates and vaccines, and that the global distribution of vaccines would be so unequal and uneven. Sparked by a once-in-a-lifetime pandemic, episodic supply chain disruptions became endemic.
But there was also a second reason why central bankers tended to downplay the threat of inflation. The ability to reassure consumers and businesses that things are—and will be—fine is, in itself, a crucial part of their job description because the belief that prices will continue rising becomes a self-fulfilling prophecy as businesses raise prices to get ahead of impending cost increases. A rise in prices is often an effect of a rise in fear as much as it is an effect of rising costs.
When the fear of inflation gains traction, a business that does not change its prices often—for example a car manufacturer—will safeguard its profit margins by getting ahead of expected future inflation (and if it has already started experiencing higher costs, making up for past inflation as well). It is at that point that words like “blip” start appearing less often in the headlines and terms like “temporary” and “transitory” show up more often—how temporary and transitory generally remains unclear. Something else happens: wages rise. When workers expect to pay more for everything, they demand higher wages from employers to keep up with rising costs of living. When firms pay their employees more, those costs are passed on to consumers in the form of higher prices. This is the vicious circle of consumer price inflation—higher prices lead to higher wages, higher wages lead to even higher prices still.
The persistence of inflation despite central bankers raising interest rates consistently for years points to some novel features of the current post-pandemic moment: corporate consolidation and market concentration may be major contributing factors to the inflationary malaise. Many companies have used inflation as an excuse to hike prices far beyond the rise in production costs, scoring some of the best financial quarters and highest profit margins in their history. Asthma inhalers are perhaps the most notorious example of this, with prices jumping from roughly $10 a decade ago to $100 now even though production costs have not risen radically. This is why neologisms like “shrinkflation” (the practice of reducing the size or weight of a product with no corresponding reduction in price) and “greedflation” (a situation where the price increase of goods is not the result of an increase in their production costs) have started appearing in our newsfeeds. There is little that central banks can do about either of these phenomena and the inflationary pressure resulting from them with the tools at their disposal. Companies enjoying a semi-monopolistic grip on consumers’ choices can set prices however they like.
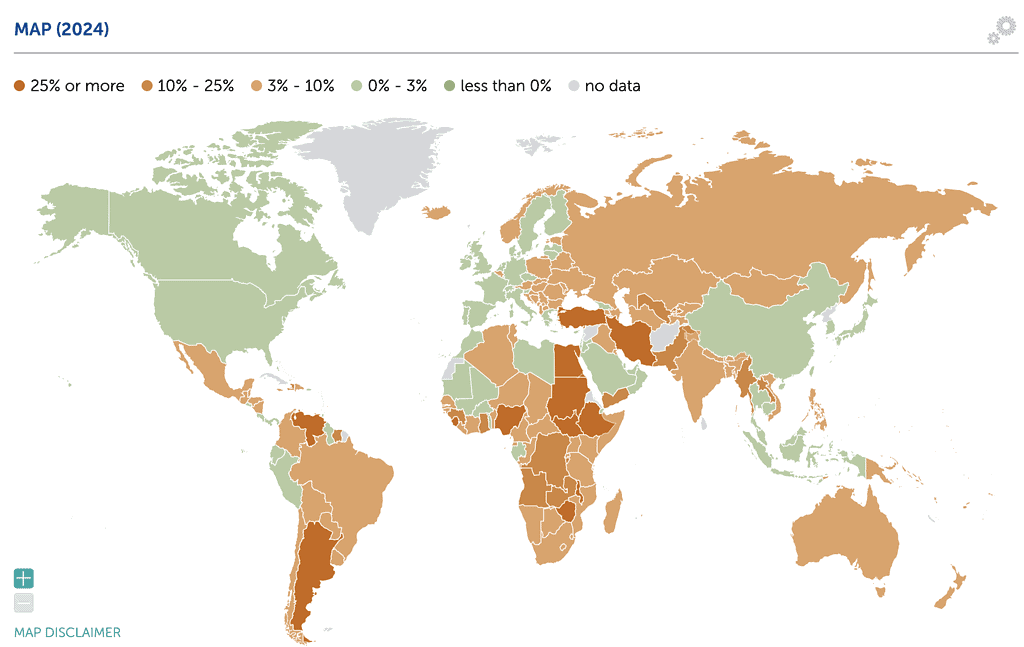
What happens, then, when inflation keeps increasing instead of declining or slowing down? Nothing good. One possibility is what economists call “stagflation” where economic growth stalls, unemployment remains high and inflation remains at elevated levels. Then there’s every central banker’s nightmare scenario: hyperinflation in which prices grow uncontrollably sending the value of the currency into a seemingly unstoppable free-fall as in Weimar Germany after World War I. But one need not look to history to find examples of hyperinflation: Zimbabwe has been struggling with spiraling inflation for over a decade; Venezuela—the IMF estimates—will hit this year an inflation rate of 250% (which, believe it or not, is a stellar improvement compared to the five-digits rates of some years ago); Sudan is forecast to come second at about 145%; Argentina’s inflation crisis catapulted an unlikely far-right candidate into the presidency; and many other nations will experience a surge in prices many times greater than the 2% threshold that most central banks set as their optimal inflation target. Hyperinflation also provides the clearest proof that expectations on a mass scale play a fundamental role in determining the price of goods and services: when millions of people believe that their currency will be worth much less tomorrow, individuals and businesses begin rejecting the national currency in favor of alternatives such as cryptocurrencies or perhaps the U.S. dollar.
Then there’s the opposite extreme: persistent deflation which is what happens when prices continually fall. Continually falling prices are worrisome because it is a symptom of a weakening economy characterized by anemic consumer spending and low production levels (which leads to falling wages, which causes even lower demand for goods and services, which leads to even lower prices). Like inflation, not all deflations are alike: Greece—which during the debt crisis experienced a deflationary phase as a result of the wage and pension cuts part of its bailout terms—fell back into negative territory shortly after the beginning pandemic. Japan’s economy had been stuck in this vicious cycle for two decades: it was officially declared to be no longer in deflation only last March and subsequently ended decades of negative interest rate monetary policy. And then there is Switzerland, which for many years suffered—but also benefited—from deflation of its own making. The country managed to sustain its exports by countering the appreciation of its currency through super-low interest rates—yet, baffling many economists—avoiding at the same time the most dramatic effects of deflation (such as a crippling contraction in economic activities or high unemployment). Things only changed in 2022, when inflation hit a three-decade high of 2.8% and the Swiss National Bank was forced to raise its policy rate from -0.75% to 1.5% to combat it.
All these peculiar scenarios demonstrate why there is no one-size-fits-all solution when it comes to the many sides of inflation. Furthermore, once a crisis is over, another one can always appear out of nowhere. Energy prices were already on the rise before the Covid-19 pandemic—Russia’s invasion of Ukraine before and the Israel-Gaza war made the situation much worse.
Will this season of global higher inflation ever come to an end, then? If we have learned anything over the past few years, it is that it is very difficult to predict the future when it depends to such a great extent on the whims of viruses, authoritarian leaders, corporate executives and, yes, consumers too. But there are signs of progress. According to the IMF, inflation is falling faster than expected in most regions: globally, it is expected to fall to 5.8% in 2024, with less than 50 countries where it will exceed last year’s figures. In the meantime, central bankers will have to constantly rely on a wide variety of data to fine-tune their assessments and policies—kicking the tires of the economy as they go, so to speak.
Inflation Rate: A Global Comparison
| Country | 2020 | 2021 | 2022 | 2023 | 2024 |
|---|---|---|---|---|---|
| Zimbabwe | 557.21 | 98.546 | 193.399 | 667.361 | 560.981 |
| Argentina | 42.015 | 48.409 | 72.431 | 133.489 | 249.793 |
| Sudan | 163.258 | 359.092 | 138.808 | 171.471 | 145.535 |
| Venezuela | 2,355.15 | 1,588.51 | 186.542 | 337.458 | 99.981 |
| Türkiye | 12.279 | 19.596 | 72.309 | 53.859 | 59.52 |
| South Sudan | 23.984 | 30.229 | -3.21 | 40.195 | 54.754 |
| Sierra Leone | 13.447 | 11.874 | 27.209 | 47.716 | 39.118 |
| Islamic Republic of Iran | 36.43 | 40.214 | 45.752 | 41.5 | 37.5 |
| Egypt | 5.7 | 4.5 | 8.5 | 24.392 | 32.547 |
| Malawi | 8.639 | 9.343 | 20.839 | 30.295 | 27.892 |
| Nigeria | 13.247 | 16.953 | 18.847 | 24.66 | 26.311 |
| Ethiopia | 20.354 | 26.794 | 33.938 | 30.219 | 25.572 |
| Pakistan | 10.741 | 8.901 | 12.148 | 29.181 | 24.757 |
| Haiti | 22.945 | 15.941 | 27.576 | 44.1 | 23.013 |
| Ghana | 9.885 | 9.976 | 31.713 | 37.531 | 22.271 |
| Angola | 22.277 | 25.765 | 21.36 | 13.639 | 22.004 |
| Burundi | 7.305 | 8.313 | 18.888 | 26.955 | 21.964 |
| Lao P.D.R. | 5.104 | 3.754 | 22.959 | 31.23 | 21.5 |
| Suriname | 34.89 | 59.12 | 52.448 | 51.582 | 20.741 |
| Democratic Republic of the Congo | 11.358 | 8.989 | 9.266 | 19.894 | 17.247 |
| Yemen | 21.673 | 31.464 | 29.511 | -1.225 | 16.909 |
| The Gambia | 5.931 | 7.37 | 11.513 | 16.966 | 15.123 |
| Myanmar | 5.725 | 3.642 | 18.385 | 27.1 | 15 |
| São Tomé and Príncipe | 9.82 | 8.138 | 18.006 | 21.184 | 14.191 |
| Uzbekistan | 12.868 | 10.849 | 11.447 | 9.951 | 11.579 |
| Zambia | 15.733 | 22.021 | 10.993 | 10.953 | 11.37 |
| Guinea | 10.602 | 12.597 | 10.499 | 7.8 | 11.034 |
| Mongolia | 3.735 | 7.359 | 15.153 | 10.348 | 9.747 |
| Bangladesh | 5.648 | 5.558 | 6.15 | 9.016 | 9.3 |
| Kazakhstan | 6.799 | 8.002 | 14.956 | 14.558 | 8.671 |
| Madagascar | 4.188 | 5.819 | 8.157 | 9.861 | 7.789 |
| Vanuatu | 5.346 | 2.343 | 6.679 | 12.041 | 7.631 |
| Algeria | 2.415 | 7.226 | 9.267 | 9.32 | 7.551 |
| Tunisia | 5.635 | 5.707 | 8.308 | 9.323 | 7.358 |
| Jamaica | 5.21 | 5.882 | 10.347 | 6.471 | 7 |
| Russia | 3.382 | 6.694 | 13.75 | 5.859 | 6.87 |
| Kyrgyz Republic | 6.323 | 11.908 | 13.91 | 10.797 | 6.687 |
| Kenya | 5.29 | 6.109 | 7.648 | 7.675 | 6.601 |
| Ukraine | 2.74 | 9.361 | 20.183 | 12.851 | 6.446 |
| Colombia | 2.525 | 3.505 | 10.183 | 11.729 | 6.39 |
| Lesotho | 4.978 | 6.048 | 8.272 | 6.343 | 6.384 |
| Niger | 2.898 | 3.838 | 4.226 | 3.701 | 6.365 |
| Liberia | 16.953 | 7.816 | 7.593 | 10.094 | 6.344 |
| Nepal | 6.15 | 3.599 | 6.261 | 7.815 | 6.312 |
| Belarus | 5.536 | 9.453 | 15.239 | 5.017 | 6.307 |
| Romania | 2.646 | 5.046 | 13.8 | 10.397 | 6.049 |
| Cameroon | 2.451 | 2.262 | 6.252 | 7.191 | 5.9 |
| Rwanda | 7.733 | 0.828 | 13.882 | 14.029 | 5.8 |
| Uruguay | 9.754 | 7.75 | 9.106 | 5.868 | 5.765 |
| Iceland | 2.848 | 4.458 | 8.307 | 8.74 | 5.609 |
| Tonga | 0.423 | 1.414 | 8.52 | 10.171 | 5.42 |
| Poland | 3.379 | 5.124 | 14.36 | 11.424 | 5.014 |
| Moldova | 3.771 | 5.099 | 28.567 | 13.437 | 5 |
| Nicaragua | 3.682 | 4.928 | 10.47 | 8.442 | 5 |
| Turkmenistan | 6.1 | 19.479 | 11.211 | -1.738 | 4.955 |
| Tajikistan | 8.58 | 8.974 | 6.641 | 3.652 | 4.915 |
| Mauritius | 2.52 | 4.039 | 10.785 | 7.045 | 4.901 |
| Bhutan | 3.048 | 8.211 | 5.935 | 4.555 | 4.898 |
| South Africa | 3.275 | 4.556 | 6.869 | 5.9 | 4.863 |
| Namibia | 2.209 | 3.62 | 6.077 | 5.88 | 4.811 |
| Somalia | 4.304 | 4.62 | 6.785 | 6.104 | 4.8 |
| Serbia | 1.576 | 4.085 | 11.982 | 12.372 | 4.759 |
| Nauru | 1.886 | 1.077 | 3.552 | 6.203 | 4.709 |
| Central African Republic | 0.881 | 4.259 | 5.579 | 3.166 | 4.705 |
| India | 6.165 | 5.506 | 6.653 | 5.375 | 4.563 |
| Bolivia | 0.942 | 0.736 | 1.747 | 2.577 | 4.484 |
| Kiribati | 2.553 | 2.054 | 5.346 | 9.277 | 4.469 |
| Mozambique | 3.142 | 5.688 | 9.77 | 6.14 | 4.439 |
| Equatorial Guinea | 4.766 | -0.094 | 4.869 | 2.499 | 4.4 |
| Honduras | 3.468 | 4.481 | 9.09 | 6.663 | 4.39 |
| Andorra | 0.092 | 1.677 | 6.203 | 5.607 | 4.266 |
| Marshall Islands | -0.658 | 2.247 | 3.234 | 6.753 | 4.25 |
| Dominican Republic | 3.781 | 8.243 | 8.812 | 4.786 | 4.229 |
| Papua New Guinea | 4.872 | 4.483 | 5.253 | 2.33 | 4.2 |
| Montenegro | -0.238 | 2.399 | 13.05 | 8.565 | 4.164 |
| Estonia | -0.634 | 4.487 | 19.447 | 9.116 | 4.159 |
| Tuvalu | 1.859 | 6.217 | 11.54 | 6.205 | 4.131 |
| Brazil | 3.212 | 8.302 | 9.28 | 4.594 | 4.113 |
| Tanzania | 3.289 | 3.69 | 4.35 | 4.036 | 4.038 |
| Guatemala | 3.211 | 4.263 | 6.882 | 6.209 | 4.025 |
| Botswana | 1.89 | 6.679 | 12.166 | 5.144 | 4.02 |
| Mexico | 3.398 | 5.693 | 7.898 | 5.525 | 4.02 |
| Micronesia | 0.964 | 1.772 | 5.02 | 6.21 | 4.018 |
| Fiji | -2.595 | 0.156 | 4.32 | 2.3 | 4 |
| Iraq | 0.574 | 6.042 | 4.987 | 4.416 | 4 |
| North Macedonia | 1.2 | 3.231 | 14.205 | 9.362 | 4 |
| Austria | 1.391 | 2.756 | 8.614 | 7.71 | 3.92 |
| Senegal | 2.529 | 2.178 | 9.689 | 5.947 | 3.9 |
| Eswatini | 3.872 | 3.719 | 4.802 | 4.949 | 3.881 |
| Barbados | 0.514 | 1.485 | 4.998 | 5.039 | 3.857 |
| Paraguay | 1.768 | 4.788 | 9.766 | 4.632 | 3.837 |
| Uganda | 2.758 | 2.207 | 7.192 | 5.352 | 3.81 |
| Côte d’Ivoire | 2.415 | 4.159 | 5.208 | 4.389 | 3.8 |
| Maldives | -1.594 | 0.213 | 2.601 | 2.616 | 3.777 |
| Croatia | -0.03 | 2.724 | 10.67 | 8.393 | 3.744 |
| Vietnam | 3.22 | 1.837 | 3.157 | 3.253 | 3.74 |
| Hungary | 3.305 | 5.105 | 14.62 | 17.14 | 3.723 |
| Slovak Republic | 2.016 | 2.828 | 12.135 | 10.962 | 3.644 |
| Belgium | 0.421 | 3.21 | 10.325 | 2.293 | 3.623 |
| Republic of Congo | 1.373 | 1.969 | 3.026 | 4.5 | 3.6 |
| Philippines | 2.393 | 3.927 | 5.821 | 5.978 | 3.583 |
| Samoa | 1.48 | -3.01 | 8.747 | 11.981 | 3.563 |
| Azerbaijan | 2.763 | 6.664 | 13.859 | 8.225 | 3.546 |
| Australia | 0.912 | 2.819 | 6.614 | 5.595 | 3.53 |
| Timor-Leste | 0.488 | 3.775 | 7.005 | 8.42 | 3.508 |
| Albania | 1.621 | 2.043 | 6.726 | 4.769 | 3.495 |
| Solomon Islands | 2.964 | -0.108 | 5.507 | 4.49 | 3.495 |
| Kosovo | 0.218 | 3.306 | 11.674 | 5.223 | 3.491 |
| Bulgaria | 1.219 | 2.842 | 13.019 | 8.599 | 3.351 |
| Norway | 1.287 | 3.484 | 5.764 | 5.518 | 3.3 |
| Chile | 3.043 | 4.524 | 11.645 | 7.583 | 3.18 |
| Kuwait | 2.102 | 3.424 | 3.981 | 3.642 | 3.168 |
| Armenia | 1.226 | 7.202 | 8.649 | 1.965 | 3.124 |
| Palau | 0.702 | -0.481 | 13.188 | 12.335 | 3.101 |
| New Zealand | 1.715 | 3.941 | 7.172 | 5.733 | 3.094 |
| Chad | 5.32 | -1.624 | 6.885 | 2.682 | 3.087 |
| Belize | 0.122 | 3.239 | 6.274 | 4.39 | 3.063 |
| Bosnia and Herzegovina | -1.052 | 1.998 | 14.012 | 6.098 | 3.032 |
| Benin | 3.049 | 1.7 | 1.4 | 2.8 | 3 |
| Guinea-Bissau | 1.463 | 3.274 | 7.917 | 7.164 | 3 |
| Singapore | -0.182 | 2.305 | 6.121 | 4.821 | 2.979 |
| St. Vincent and the Grenadines | -0.606 | 1.557 | 5.66 | 4.571 | 2.955 |
| United States | 1.249 | 4.682 | 7.992 | 4.128 | 2.907 |
| Libya | 1.468 | 2.88 | 4.51 | 3.428 | 2.863 |
| Malta | 0.794 | 0.715 | 6.125 | 5.655 | 2.861 |
| Dominica | -0.727 | 1.571 | 7.707 | 3.463 | 2.808 |
| Guyana | 1.232 | 3.321 | 6.477 | 4.537 | 2.794 |
| Malaysia | -1.139 | 2.477 | 3.379 | 2.489 | 2.793 |
| Mauritania | 2.382 | 3.558 | 9.553 | 4.949 | 2.785 |
| Greece | -1.262 | 0.574 | 9.3 | 4.155 | 2.749 |
| Togo | 1.831 | 4.548 | 7.616 | 5.059 | 2.742 |
| Slovenia | -0.055 | 1.917 | 8.834 | 7.447 | 2.733 |
| Jordan | 0.397 | 1.319 | 4.224 | 2.163 | 2.72 |
| Spain | -0.337 | 3.008 | 8.323 | 3.4 | 2.674 |
| Netherlands | 1.106 | 2.819 | 11.617 | 4.117 | 2.66 |
| Antigua and Barbuda | 1.058 | 1.627 | 7.531 | 5.067 | 2.634 |
| Canada | 0.717 | 3.395 | 6.803 | 3.879 | 2.606 |
| Georgia | 5.202 | 9.567 | 11.898 | 2.488 | 2.58 |
| Qatar | -2.523 | 2.277 | 4.96 | 3.086 | 2.58 |
| Sweden | 0.658 | 2.651 | 8.055 | 5.91 | 2.574 |
| Indonesia | 2.031 | 1.561 | 4.139 | 3.713 | 2.557 |
| Luxembourg | 0.006 | 3.468 | 8.15 | 2.929 | 2.539 |
| Korea | 0.537 | 2.498 | 5.09 | 3.593 | 2.522 |
| St. Kitts and Nevis | -1.177 | 1.206 | 2.669 | 3.611 | 2.46 |
| United Kingdom | 0.851 | 2.588 | 9.067 | 7.306 | 2.453 |
| Israel | -0.587 | 1.492 | 4.395 | 4.208 | 2.448 |
| France | 0.527 | 2.068 | 5.903 | 5.662 | 2.417 |
| Germany | 0.371 | 3.212 | 8.666 | 6.03 | 2.406 |
| Ireland | -0.443 | 2.413 | 8.049 | 5.209 | 2.38 |
| Aruba | -1.313 | 0.744 | 5.52 | 3.366 | 2.345 |
| Peru | 1.827 | 3.979 | 7.871 | 6.269 | 2.328 |
| Cyprus | -1.098 | 2.243 | 8.084 | 3.943 | 2.312 |
| Hong Kong SAR | 0.251 | 1.569 | 1.881 | 2.097 | 2.3 |
| Cambodia | 2.938 | 2.921 | 5.327 | 2.143 | 2.268 |
| San Marino | -0.133 | 2.083 | 5.304 | 6.079 | 2.264 |
| Saudi Arabia | 3.445 | 3.063 | 2.474 | 2.327 | 2.257 |
| Portugal | -0.121 | 0.941 | 8.103 | 5.264 | 2.248 |
| Japan | -0.027 | -0.235 | 2.497 | 3.268 | 2.237 |
| Morocco | 0.688 | 1.366 | 6.641 | 6.137 | 2.158 |
| Czech Republic | 3.161 | 3.84 | 15.1 | 10.661 | 2.138 |
| Burkina Faso | 1.885 | 3.908 | 13.779 | 0.942 | 2.1 |
| United Arab Emirates | -2.076 | -0.113 | 4.827 | 1.623 | 2.1 |
| Gabon | 1.703 | 1.077 | 4.25 | 3.634 | 2.09 |
| The Bahamas | 0.039 | 2.905 | 5.605 | 3.059 | 2.042 |
| Cabo Verde | 0.605 | 1.863 | 7.93 | 3.148 | 2 |
| Comoros | 0.8 | -0.015 | 12.444 | 8.482 | 1.957 |
| Latvia | 0.081 | 3.239 | 17.245 | 9.058 | 1.954 |
| Puerto Rico | -0.497 | 2.41 | 6.018 | 2.804 | 1.9 |
| Taiwan | -0.238 | 1.971 | 2.947 | 2.492 | 1.881 |
| Djibouti | 1.779 | 1.181 | 5.172 | 1.8 | 1.811 |
| St. Lucia | -1.755 | 2.41 | 6.373 | 3.651 | 1.759 |
| Panama | -1.55 | 1.631 | 2.86 | 1.486 | 1.735 |
| Grenada | -0.742 | 1.22 | 2.582 | 3.037 | 1.709 |
| Macao SAR | 0.811 | 0.027 | 1.045 | 0.936 | 1.7 |
| Italy | -0.145 | 1.941 | 8.736 | 5.903 | 1.673 |
| Switzerland | -0.725 | 0.582 | 2.834 | 2.134 | 1.537 |
| Trinidad and Tobago | 0.599 | 2.061 | 5.826 | 4.629 | 1.484 |
| Lithuania | 1.062 | 4.625 | 18.858 | 8.685 | 1.46 |
| Denmark | 0.333 | 1.944 | 8.534 | 3.353 | 1.459 |
| Bahrain | -2.325 | -0.611 | 3.635 | 0.075 | 1.4 |
| Ecuador | -0.339 | 0.133 | 3.466 | 2.216 | 1.367 |
| Brunei Darussalam | 1.94 | 1.733 | 3.683 | 0.37 | 1.3 |
| Oman | -0.395 | 1.664 | 2.512 | 0.947 | 1.3 |
| Finland | 0.383 | 2.066 | 7.172 | 4.34 | 1.212 |
| Mali | 0.481 | 3.808 | 9.734 | 2.053 | 1 |
| China | 2.492 | 0.918 | 1.975 | 0.228 | 0.97 |
| El Salvador | -0.37 | 3.468 | 7.196 | 4.047 | 0.896 |
| Thailand | -0.847 | 1.231 | 6.077 | 1.228 | 0.7 |
| Costa Rica | 0.725 | 1.727 | 8.275 | 0.525 | 0.286 |
| Seychelles | 1.203 | 9.77 | 2.625 | -1.035 | -0.239 |
| Afghanistan | 5.607 | 7.762 | 10.6 | n/a | n/a |
| Eritrea | n/a | n/a | n/a | n/a | n/a |
| Lebanon | 84.88 | 154.759 | 171.195 | n/a | n/a |
| Sri Lanka | 4.569 | 5.954 | 45.214 | n/a | n/a |
| Syria | n/a | n/a | n/a | n/a | n/a |
| West Bank and Gaza | -0.711 | 1.238 | 3.74 | 5.872 | n/a |